

Pressure is Mounting
If your organization is like most, there’s pressure mounting to use data & analytics. This pressure comes from a variety of sources. We’re constantly inundated with the latest buzz words, such as “AI,” “automation” & “digital transformation.” We see headlines in the news on big data and examples of how it’s being leveraged by large corporations and sports teams. It’s leading to a fear of missing out amongst everyone, including business leaders & IoT professionals.
Take a Step Back & Deep Breath
The rising pressure can tempt us to go for big wins right away. However, the first thing we need to do is take a step back, take a deep breath and consider the path it typically takes to yield successful results. Consider the example of a historically losing sports team, with a goal of reaching a championship one day. Rarely do they achieve such a goal overnight.
The team must make a commitment to a process, that involves making small steps towards their goal, in a logical order. This could mean drafting the right players, engaging in good coaching, holding meaningful practices, building synergies amongst team members & acquiring the necessary free agents when the timing is right.
The same is true with analytics. We need to start in the right place, and build on a good foundation with appropriate steps, in the right order. The starting point can look something like this: determining realistic projects needed right now, building a proof of concept around the best one(s) and putting processes in place around using them.
Now, Gather Your Ideas & Rate Them
So which are the right projects to start with? Here are some ideas to select them:
1. Start an idea log. This can be stored in a journal, excel document, or wherever works for you. The key is to constantly log opportunities to use your data for something useful. They can be your own unique ideas, arrive in feedback from a survey to stakeholders or even from a brainstorming session you proactively hold with your peers. They might come from all of these places! But the most important thing is to log them in the same place always!
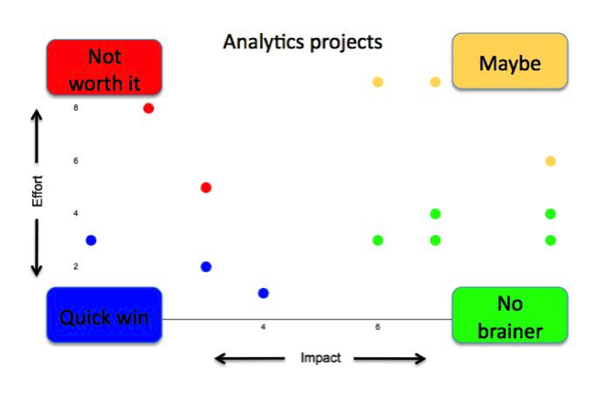
2. Assign a rating to each idea. Estimate the amount of effort you believe each project would require, as well as the impact you believe each would have. These estimations will not be perfect. However, working through this exercise will allow you to do an initial assessment of which might be good fits as initial projects in your analytics journey. I’d recommend laying them out in a scatter plot as shown in the following image:
Then, Build a POC
A good next step can be to focus on building a proof of concept (POC) of the project you’ve chosen to start with. Examine the data you have available for this project and create a profile of it. This can include:
1. Documenting what data’s available
2. Documenting what data’s not available
3. Documenting who the experts are on the data (ex: is it a finance analyst, operations manager, IT analyst, etc.?)
Building this profile will help immensely in building the proof of concept, as well as down the road if you decide to scale this into a bigger, broader project. It allows you to remember what’s available and who to go to with questions if you have to “start and stop” the project due to other pressing needs that arise mid-stream. It also allows you to increase the speed to which you can bring others into the project -- if and when the time comes. The basics of the data being used will be documented!
Once you’ve profiled the data available, build a first pass of the analysis. This might be as simple as building an excel worksheet, presenting the data in a way it’s never been seen before. Or, it could be a data visualization / dashboard that accomplishes the same. The primary objective in this phase, is to produce a “minimum viable product” that demonstrates the value the data can have in solving a real business problem.
Most Importantly, Implement a Process
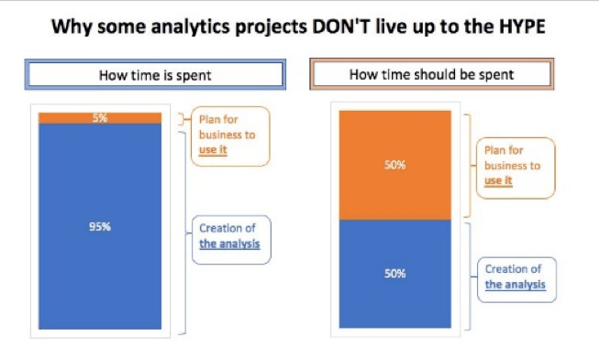
Many will stop at the previous phase. They will create an analysis, and trust that others will understand and utilize it. It’s critical to understand the risk associated with this. This may seem counter-intuitive, but often, impactful analytics work is actually just getting started at the time an analysis is published.
Remember that even a masterpiece of an analysis can produce low-to-no value without a plan to:
1. Engage those that will be using it and
2. embed it into new or existing business processes.
The following is a visual depiction of the risk associated with stopping the application of effort at the time an analysis is published:
Here are some quick tips post deployment to ensure you’re getting the full value from your project:
Educate & engage users by:
- Developing a training plan for users that focuses on how they will/should be using what you’ve created
- Creating a mechanism for feedback gathering & a process to manage enhancement requests
- Developing a report that measures usage & results, and proactively reach out to less engaged users
Consider first meeting with the managers of individuals that will be the primary users of your project, before its deployed to the entire user base. Gaining their buy in on use-cases, and factoring in their feedback prior to deployment/training can be critical to a successful launch.
Build processes around the analysis, such as:
- Publishing insights on a regular basis (i.e. “same time, same place”)
- Hosting business review meetings, leveraging insights from the analysis
- Proactively asking questions of users about key insights (i.e. get curious!)
NOTE: If an entirely new business process or adjustment to an existing one needs to be made in light of the new analytical project you’ve created, be sure to address this and share it / gather feedback from the appropriate stakeholders!
Bringing it All Together
In summary, the goal of this approach is to:
1. Determine realistic projects needed now
2. Build a proof of concept of the best one(s)
3. Put a process in place around using it
A pro to taking this approach, is that it allows you to start small, build momentum around addressing a business problem using analytics, and witness the demonstrated results from it. Doing so can allow you to build a business case for additional investment for more advanced analytics/projects, based on real results, if the initial results are positive.
BONUS: IoT Analytics Project Starters
Having trouble starting your idea log for analytics projects?
Here are nine (9) basic project concepts to get started.
Could you use your data to do any of the following?
| CONCEPT | |
| Find highly engaged users | Reach out and request product reviews |
| Find customers likely to purchase another product | Market to them |
| Find the users not utilizing the product | Reach out |
| Find which industries drive sales & engagement | Let this guide marketing investment |
| Build a model that assigns retention probability | Let this guide sales & marketing deployment |
| Calculate the time to make a second purchase | Use to market to “one-time” purchasers at right time |
| Proactively monitor devices for issues | Engage in Proactive Support |
| Determine items typically purchased together | Identify users that have white space to capture |
| Map out locations of issues or engagement levels | If correlation with a regional factor, address it |
© 2022 Dustin Schimek, CSD Business Solutions LLC