---
title: Understanding and Improving Your LoRaWAN® Coverage
description: For 10 years, LoRaWAN technology has emerged as the fastest growing connectivity solution for the digital transformation of utilities with IoT worldwide.
image: https://blog.lora-alliance.org/hubfs/Understanding%20and%20Improving%20Your%20LoRaWAN%20Coverage.jpeg
---
[](https://lora-alliance.org/)
- [LoRa Alliance®](https://lora-alliance.org/)
- LoRaWAN®
- [Certification](https://lora-alliance.org/lorawan-certification/)
- Membership
- [Products & Services](https://lora-alliance.org/showcase/)
- [Resources](https://resources.lora-alliance.org/)
### Topics
- Select a Topic
[LoRaWAN®](https://blog.lora-alliance.org/tag/lorawan) [IoT Ventures](https://blog.lora-alliance.org/tag/iot-ventures) [Coverage](https://blog.lora-alliance.org/tag/coverage)
# Understanding and Improving Your LoRaWAN® Coverage

By [Michael Ellyett, Executive Director, IoT Ventures](https://blog.lora-alliance.org/author/michael-ellyett-executive-director-iot-ventures) on August, 6 2026
[mailto:?body=https://blog.lora-alliance.org/understanding-and-improving-your-lorawan-coverage](mailto:?body=https://blog.lora-alliance.org/understanding-and-improving-your-lorawan-coverage)

Understanding and Improving Your LoRaWAN Coverage
Whether planning a new LoRaWAN deployment or operating with an existing solution, every user has the right to understand the coverage provided to their devices and the level of service they receive. LXC is a platform on which end-to-end LoRaWAN solutions are built, integrating with all LoRaWAN Network Servers (LNS) and providing this performance information.
LoRaWAN enables you to use existing networks and extend them. If you have a lot of devices in well-bounded areas, it often makes sense to have your own network so that your LoRaWAN costs are like your Wi-Fi costs and entirely internal.
Before extending a network, you need to know where the gaps are. To understand the gaps, you need to know what the requirements are and what the current network provides, i.e. what coverage you have where.
The key steps are as follows.
# Defining Your Coverage Needs
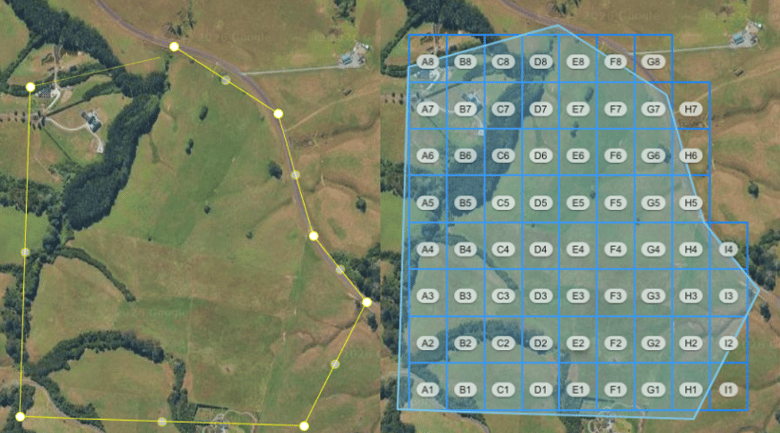
- Define the areas and places — you can draw them directly on a map, generate a grid, or import them from another source (often you will want to).
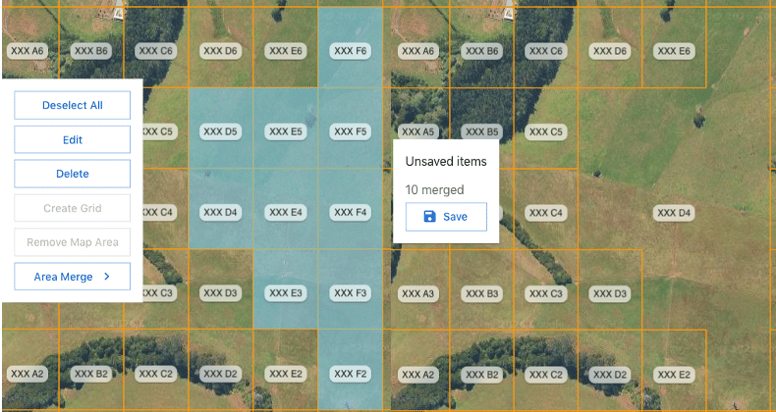
- Areas may not be uniform. If many adjacent areas have the same coverage, you may want to aggregate them into a single large area. In other areas, you may split them into several smaller areas.
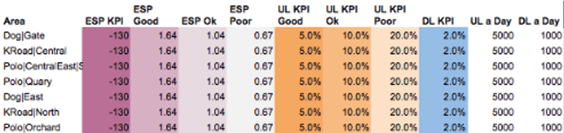
- You will want to define what your metrics are for each area (or accept the defaults). What signal power will be Good, OK, Poor and Bad and what percentage of Messages missed would mean Good, OK, Poor or Bad for your scenario, value proposition and location?

# Understanding Current Coverage
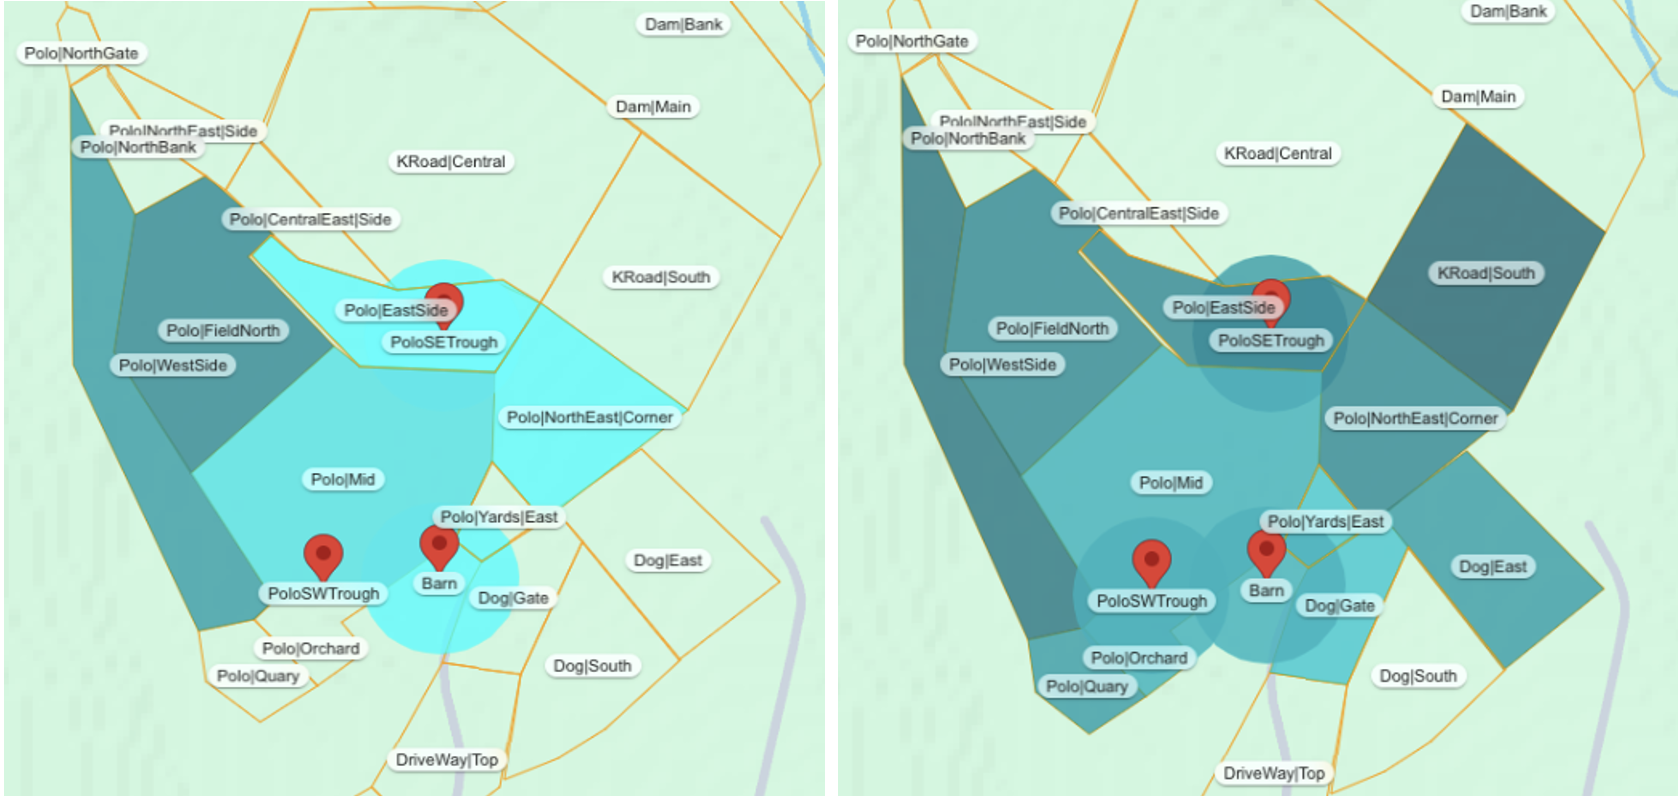
Just drawing circles around gateways is unhelpful when what you want to know is ‘is there coverage where my entities actually are?’ and ‘what is the quality of coverage at those places or areas?’. For example, our office is 3km from a gateway on a tower 350m in the air that is receiving messages from devices 40km away. The published coverage map shows we have coverage, but our office is in a blind spot and has none.
Depending on your situation, what you want to understand may vary, e.g. signal strength, noise, net signal intelligibility, dropped messages, etc. You will also want to understand how coverage changes over time and what the variability is. In the real world, things change, e.g. gateway configurations, antenna positions, device load, etc., so you will want to understand coverage over any period of time.
# Undertake a New Coverage Survey
A coverage survey in LXC is based on all messages from all devices, originating from all/specified areas/places of interest, via all/selected networks and all/selected gateways, over a defined period.
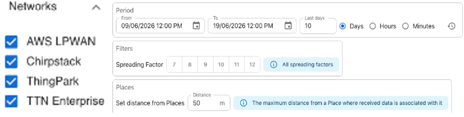
Coverage for a place can also optionally consider things within a few meters of that place. This is so that if your survey is conducted using devices on cattle, sheep, horses, etc., or by a farm bike or worker, you can get a view of coverage in those areas.

# Analysing the Results
As well as presenting results within LXC, it is useful to be able to analyse a coverage survey and requirements in a spreadsheet. In different circumstances, you are trying to understand different things, e.g., where to put a gateway, where coverage gaps are, and where performance needs improvement.
The inputs to the analysis are:
#### Coverage survey results for each area or place

#### Coverage requirements for each area or place
### Analysing performance
Analysis can show a lot of detail or just the overall position
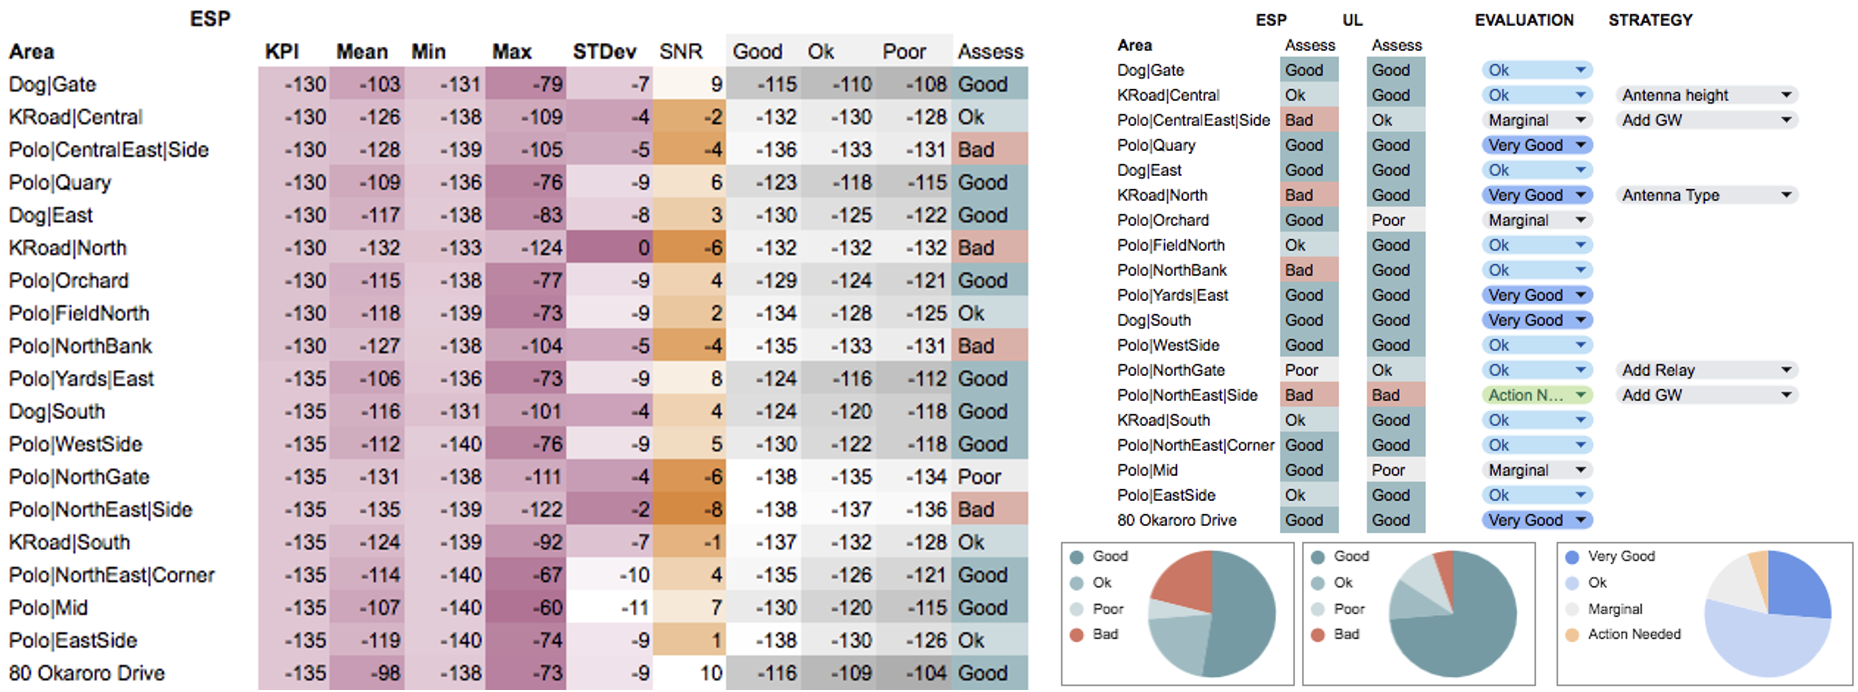
Various charts can be used to examine information.
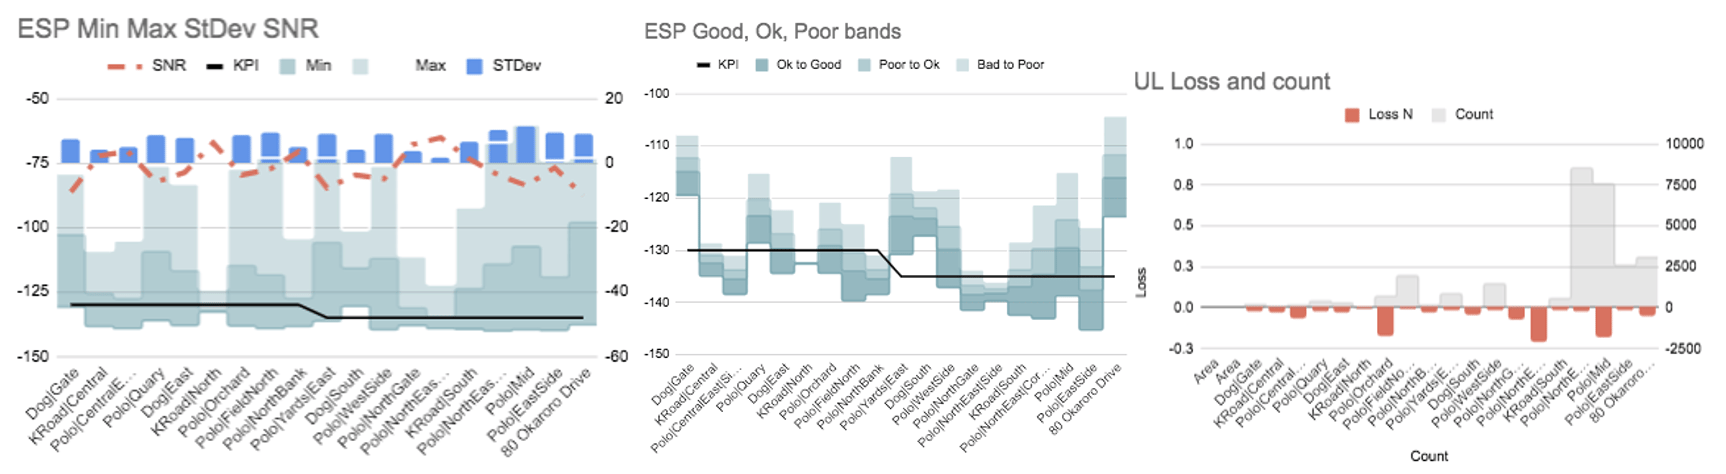
If there are a large number of areas/places, data can be aggregated or filtered.
Path coverage is useful for understanding what could be causing poor coverage, e.g. obstructions.
# Determining Your Network Enhancement Strategy
There are a number of causes of poor network service, e.g. range, overload (congestion), obstructions, and interference.
There are several mechanisms for extending coverage, e.g., gateways, relays, direct-to-satellite, and meshes. Having worked with all, we would suggest that each has a role to play.
Determining which approach makes sense may require more detailed analysis of the various paths (from gateway to device) and analysis of gateway statistics. It will often make sense to analyse RSSI or SNR independently (both are captured in the survey).
Often, the answer is as simple as adjusting existing equipment or adding a few gateways or relays. Once implemented, you can run the survey again to confirm the impact of your changes.
# Making the Most of the LoRaWAN Advantage
The flexibility to work with public networks, operate your own network, or use a hybrid approach is a key advantage of LoRaWAN. Using data to inform coverage planning and optimisation within and across networks is a core capability for solution providers and end users alike, ensuring solution value is delivered.
--
Interested in becoming a guest blogger for the LoRa Alliance®? Please contact [marketing@lora-alliance.com](mailto:marketing@lora-alliance.com)with your blog idea and draft.
[More from this author](https://blog.lora-alliance.org/author/michael-ellyett-executive-director-iot-ventures)

###### Michael Ellyett, Executive Director, IoT Ventures
#### Recommended Articles
[.png)](https://blog.lora-alliance.org/no-wires-no-waste-what-the-water-in-india-conference-revealed-about-lorawans-critical-role-in-indias-water-crisis)
###### [No Wires, No Waste: What the 'Water in India' Conference Revealed About LoRaWAN's Critical Role in India's Water Crisis](https://blog.lora-alliance.org/no-wires-no-waste-what-the-water-in-india-conference-revealed-about-lorawans-critical-role-in-indias-water-crisis)
- August 19, 2026
[](https://blog.lora-alliance.org/how-ai-powered-zone-level-tracking-captured-attention-at-mwc)
###### [How AI-Powered Zone-Level Tracking Captured Attention at MWC](https://blog.lora-alliance.org/how-ai-powered-zone-level-tracking-captured-attention-at-mwc)
- March 26, 2026
#### Recommended Articles
#### Recommended Articles
Search Article
### Popular Posts
### Recent Post
### Recent Posts
[No Wires, No Waste: What the 'Water in India' Conference Revealed About LoRaWAN's Critical Role in India's Water Crisis](https://blog.lora-alliance.org/no-wires-no-waste-what-the-water-in-india-conference-revealed-about-lorawans-critical-role-in-indias-water-crisis)
- 6 August, 2026
[Understanding and Improving Your LoRaWAN® Coverage](https://blog.lora-alliance.org/understanding-and-improving-your-lorawan-coverage)
- 6 August, 2026
[How AI-Powered Zone-Level Tracking Captured Attention at MWC](https://blog.lora-alliance.org/how-ai-powered-zone-level-tracking-captured-attention-at-mwc)
- 6 August, 2026
[Powering the Future: How Energy Harvesting and LoRaWAN® Enable Battery-Free AI Vision](https://blog.lora-alliance.org/powering-the-future-how-energy-harvesting-and-lorawan-enable-battery-free-ai-vision)
- 6 August, 2026
[LoRaWAN® Takes Center Stage at Salon des Maires 2025: A Milestone for Connected Territories in France](https://blog.lora-alliance.org/lorawan-takes-center-stage-at-salon-des-maires-2025)
- 6 August, 2026
###### ABOUT THE ORGANIZATION
### LoRa Alliance®
The LoRa Alliance® is an open, non-profit association with the mission to support and promote the global adoption of the LoRaWAN® standard, the leading LPWAN.
-
-
-
-
### Topics
- [LoRaWAN® (23)](https://blog.lora-alliance.org/tag/lorawan)
- [LPWAN (13)](https://blog.lora-alliance.org/tag/lpwan)
- [IoT (12)](https://blog.lora-alliance.org/tag/iot)
- [LoRa Alliance® (11)](https://blog.lora-alliance.org/tag/lora-alliance)
- [Guest Blog (10)](https://blog.lora-alliance.org/tag/guest-blog)
- [Article (5)](https://blog.lora-alliance.org/tag/article)
- [Smart Cities (4)](https://blog.lora-alliance.org/tag/smart-cities)
- [Energy Harvesting (3)](https://blog.lora-alliance.org/tag/energy-harvesting)
- [Security (3)](https://blog.lora-alliance.org/tag/security)
- [AI (2)](https://blog.lora-alliance.org/tag/ai)
- [Analytics (2)](https://blog.lora-alliance.org/tag/analytics)
- [Benefits (2)](https://blog.lora-alliance.org/tag/benefits)
- [Blog (2)](https://blog.lora-alliance.org/tag/blog)
- [LoRaWAN World Expo (2)](https://blog.lora-alliance.org/tag/lorawan-world-expo)
- [Member Benefits (2)](https://blog.lora-alliance.org/tag/member-benefits)
- [Membership (2)](https://blog.lora-alliance.org/tag/membership)
- [People & Planet (2)](https://blog.lora-alliance.org/tag/people-planet)
- [Semtech (2)](https://blog.lora-alliance.org/tag/semtech)
- [Smart Agriculture (2)](https://blog.lora-alliance.org/tag/smart-agriculture)
- [Smart Buildings (2)](https://blog.lora-alliance.org/tag/smart-buildings)
- [Sustainability (2)](https://blog.lora-alliance.org/tag/sustainability)
- [press release (2)](https://blog.lora-alliance.org/tag/press-release)
- [technical release (2)](https://blog.lora-alliance.org/tag/technical-release)
- [A2A Smart City (1)](https://blog.lora-alliance.org/tag/a2a-smart-city)
- [Actility (1)](https://blog.lora-alliance.org/tag/actility)
- [Analyst (1)](https://blog.lora-alliance.org/tag/analyst)
- [Approved Standard (1)](https://blog.lora-alliance.org/tag/approved-standard)
- [BlueTooth (1)](https://blog.lora-alliance.org/tag/bluetooth)
- [Browan Communications (1)](https://blog.lora-alliance.org/tag/browan-communications)
- [Certification (1)](https://blog.lora-alliance.org/tag/certification)
- [Coverage (1)](https://blog.lora-alliance.org/tag/coverage)
- [Dryad (1)](https://blog.lora-alliance.org/tag/dryad)
- [EU (1)](https://blog.lora-alliance.org/tag/eu)
- [Europe (1)](https://blog.lora-alliance.org/tag/europe)
- [Everynet (1)](https://blog.lora-alliance.org/tag/everynet)
- [FUOTA (1)](https://blog.lora-alliance.org/tag/fuota)
- [India (1)](https://blog.lora-alliance.org/tag/india)
- [IoT Ventures (1)](https://blog.lora-alliance.org/tag/iot-ventures)
- [Israel (1)](https://blog.lora-alliance.org/tag/israel)
- [Italy (1)](https://blog.lora-alliance.org/tag/italy)
- [LCTT (1)](https://blog.lora-alliance.org/tag/lctt)
- [LoRa Alliance Membership (1)](https://blog.lora-alliance.org/tag/lora-alliance-membership)
- [LoRaWAN CertifiedCM (1)](https://blog.lora-alliance.org/tag/lorawan-certifiedcm)
- [LoRaWAN End Device (1)](https://blog.lora-alliance.org/tag/lorawan-end-device)
- [LoRaWAN Live (1)](https://blog.lora-alliance.org/tag/lorawan-live)
- [Massive Deployments (1)](https://blog.lora-alliance.org/tag/massive-deployments)
- [Membership Information (1)](https://blog.lora-alliance.org/tag/membership-information)
- [Middle East (1)](https://blog.lora-alliance.org/tag/middle-east)
- [Minol Zenner Group (1)](https://blog.lora-alliance.org/tag/minol-zenner-group)
- [Netmore (1)](https://blog.lora-alliance.org/tag/netmore)
- [Network Flexibility (1)](https://blog.lora-alliance.org/tag/network-flexibility)
- [SenRa (1)](https://blog.lora-alliance.org/tag/senra)
- [Smart Utilities (1)](https://blog.lora-alliance.org/tag/smart-utilities)
- [Smart Water (1)](https://blog.lora-alliance.org/tag/smart-water)
- [Unidata (1)](https://blog.lora-alliance.org/tag/unidata)
- [Utilities (1)](https://blog.lora-alliance.org/tag/utilities)
- [Wi-Fi (1)](https://blog.lora-alliance.org/tag/wi-fi)
- [ZENNER (1)](https://blog.lora-alliance.org/tag/zenner)
- [asset tracking (1)](https://blog.lora-alliance.org/tag/asset-tracking)
- [bui (1)](https://blog.lora-alliance.org/tag/bui)
- [safety (1)](https://blog.lora-alliance.org/tag/safety)
- [scale (1)](https://blog.lora-alliance.org/tag/scale)
- [smart industry (1)](https://blog.lora-alliance.org/tag/smart-industry)
see all

LoRa Alliance®
39221 Paseo Padre Pkwy, Suite J
Fremont, CA 94538
Important Links
- [Home](https://lora-alliance.org/)
- [LoRaWAN®](https://lora-alliance.org/about-lorawan/)
- [Certification](https://lora-alliance.org/lorawan-certification/)
- [Membership](https://lora-alliance.org/become-a-member/)
- [Products](https://lora-alliance.org/showcase/)
- [Resources](https://resources.lora-alliance.org/)

[+1 510-492-4044](tel:+15104924044)

[admin@lora-alliance.org](mailto:admin@lora-alliance.org)

LoRa Alliance®
39221 Paseo Padre Pkwy, Suite J
Fremont, CA 94538
Copyright © 2022 LoRa Alliance® | [Terms of Use](https://lora-alliance.org/terms-of-use/) | [Privacy & Cookie Policy](https://lora-alliance.org/privacy-policy/)
-
-
-